Is the yield curve signalling recession?
With the flattening of the yield curve often a predictor of recession, this article looks at what’s happening in fixed income markets and what could be in store.
The value of investments can fall as well as rise and that you may not get back the amount you originally invested.
Nothing in these briefings is intended to constitute advice or a recommendation and you should not take any investment decision based on their content.
Any opinions expressed may change or have already changed.
Written by Daniel Casali, Chief Investment Strategist
Published on 04 May 20225 minute read

While equity market volatility always draws the most headlines, there has also been some interesting activity in fixed income markets recently. In particular, the flattening of the yield curve has been garnering a lot of attention. The yield on the US 2-year treasury ticked briefly above that of the 10-year treasury (a yield curve ‘inversion’) at the start of the April1. Historically, this has been a good predictor of economic recession, often resulting in negative consequences for equity markets. The question is whether this curve inversion will have the same predictive power today.
What leads to a yield curve inversion?
When the economy is expanding, we would expect yields to be higher on longer-term debt; that is, we would expect the yield curve to be upward sloping. This is due to the risks associated with locking up capital in an investment for a longer time period, with investors typically receiving greater compensation for taking these risks (the ‘term-premium’). However, when the economy slows, investors typically rotate into longer-term bonds to reduce risk in their portfolios. This reduces the yields available on these assets, which can lead to inversion.
What is the curve telling us?
When we look at this relationship in the today’s market, we find that different parts of the curve are telling different stories. It is therefore worth examining which comparison is the more reliable predictor of recession. Certainly, the gap (otherwise known as spread) between the two and 10-year treasury yield has historically been a relatively robust predictor. As chart 1 shows, whenever these measures have inverted and dipped below zero, a US recession has followed. However, it hasn’t been a perfect measure: the timing of the start of recession after the yield curve inversion (and associated equity market performance) has varied, and it did give something of a false flag in 1966, when recession did not subsequently occur until 1969.
Chart 1: Treasury term spreads tend to turn negative before US recessions
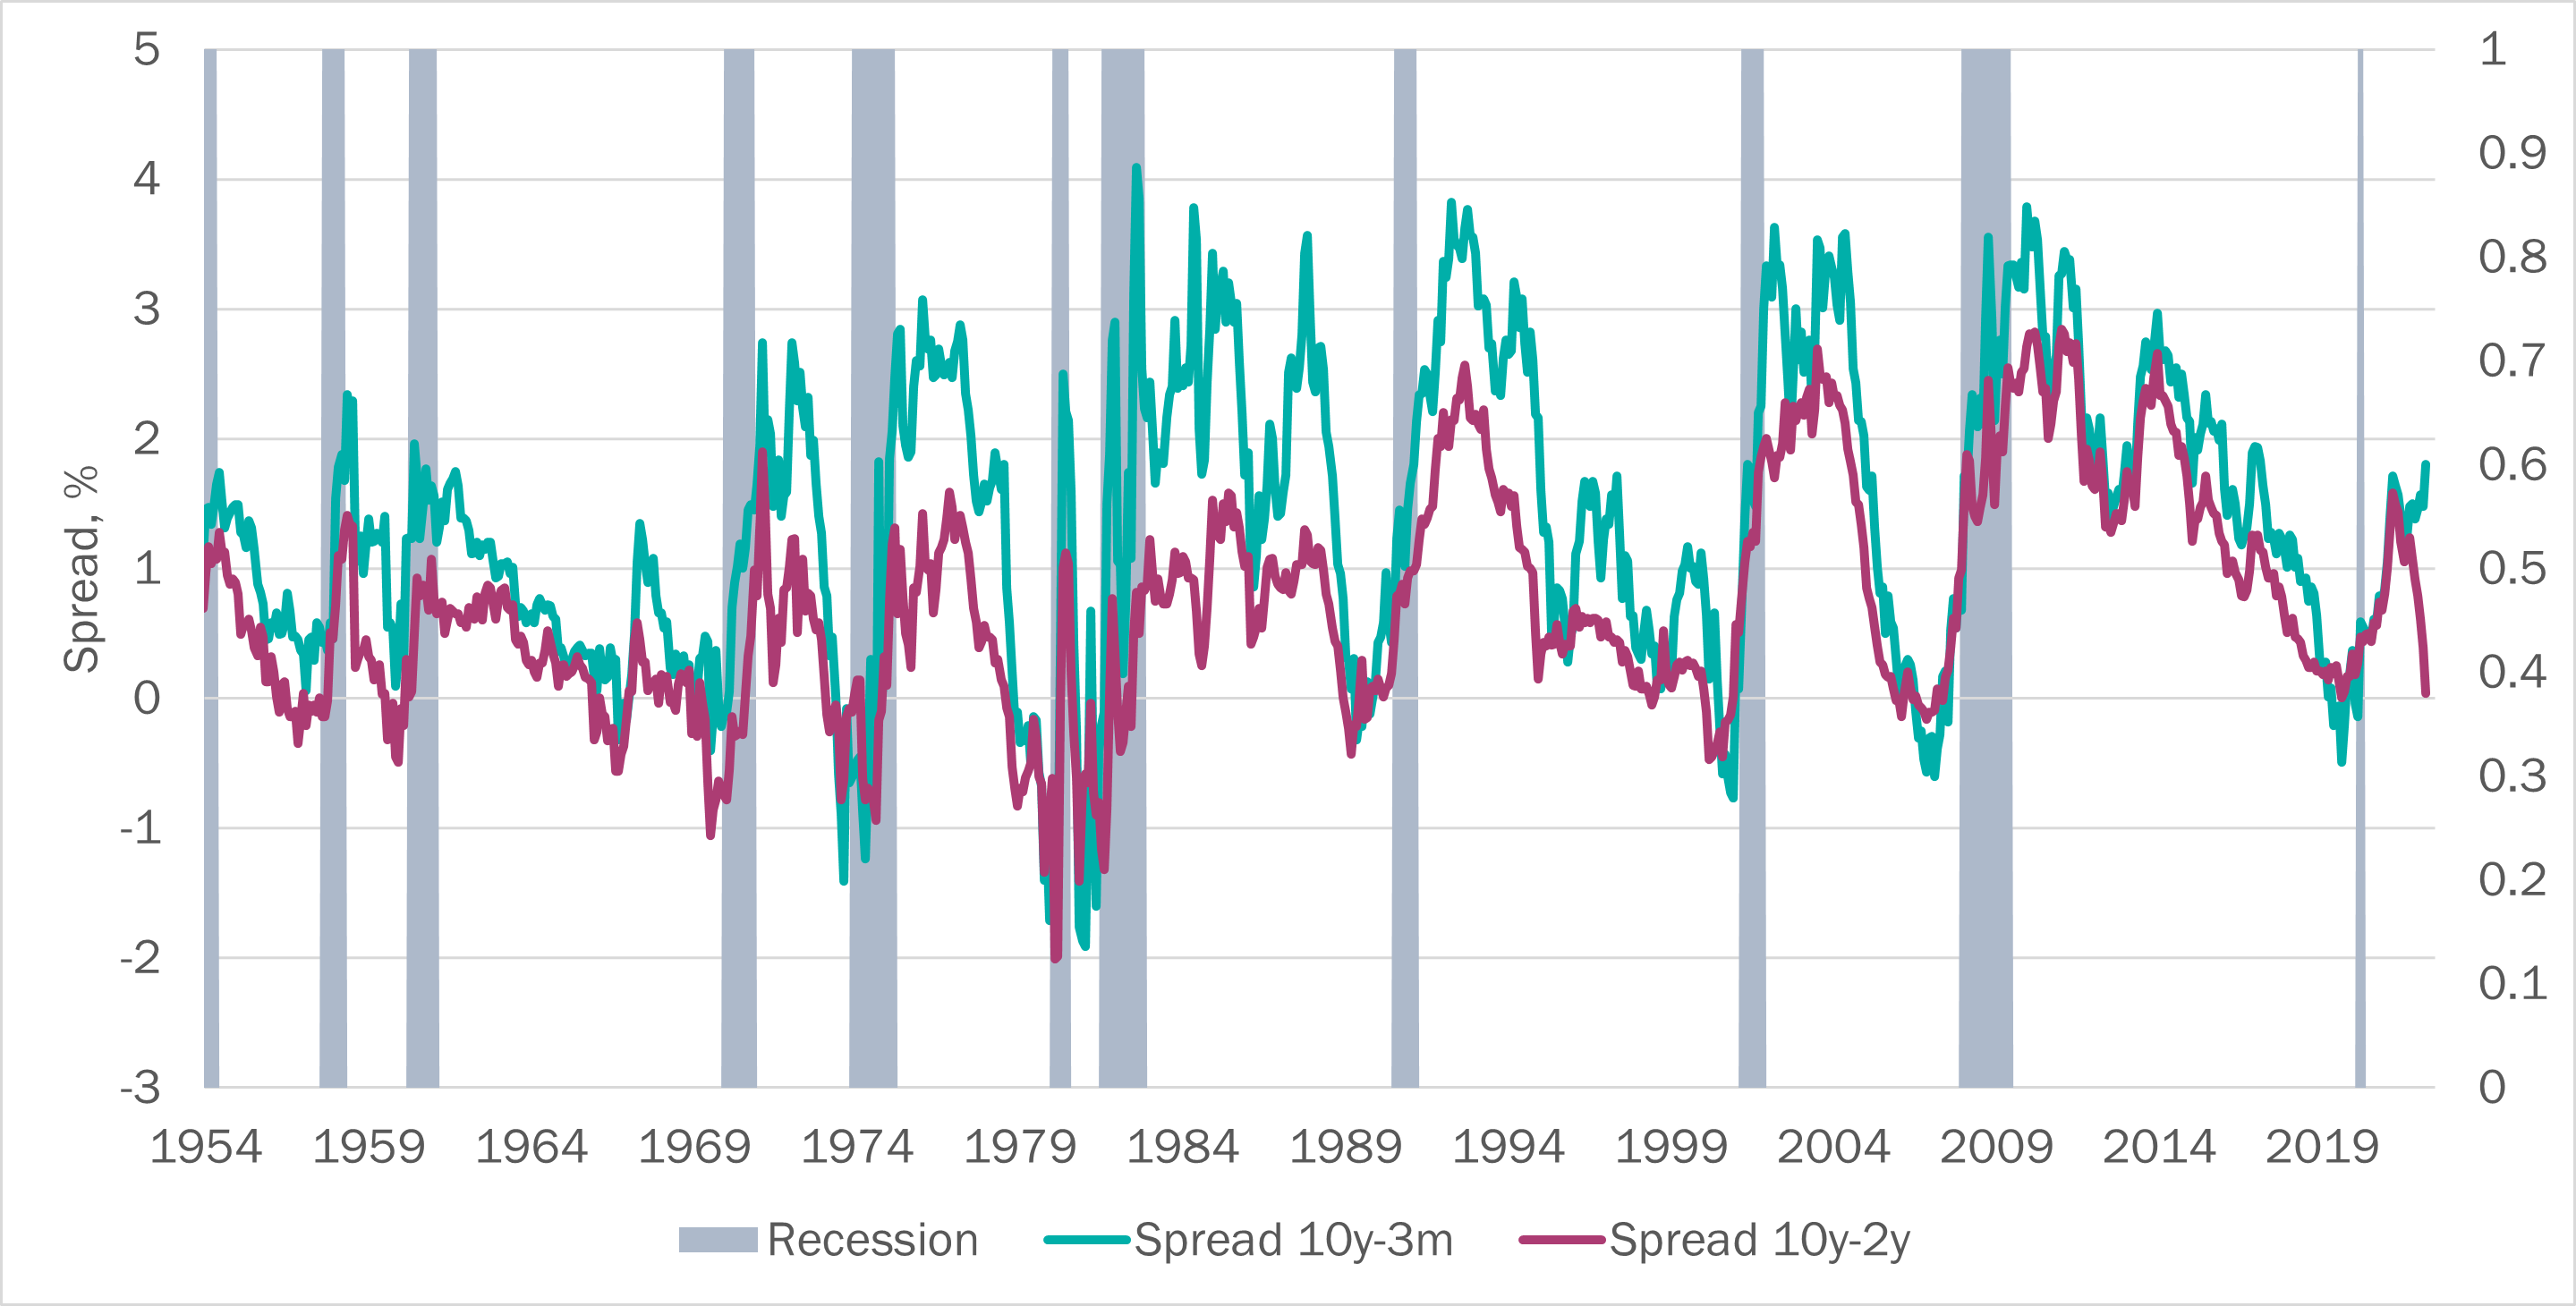
Source: Global Financial Data/Bloomberg/Tilney Investment Management Services Limited, data as at 11 April 2022. Past performance is not a guide to future performance.
Today, shorter-term yields are giving a different message. As chart 2 shows, both the 10yr-3m spread and the Federal Reserve’s preferred measure, the ‘near term forward spread’ (the difference between the 3-month yield and what the market is saying that yield will be in 18 months) have moved significantly higher, while the 10yr-2yr spread has collapsed.
Chart 2: Slope of the US yield curve
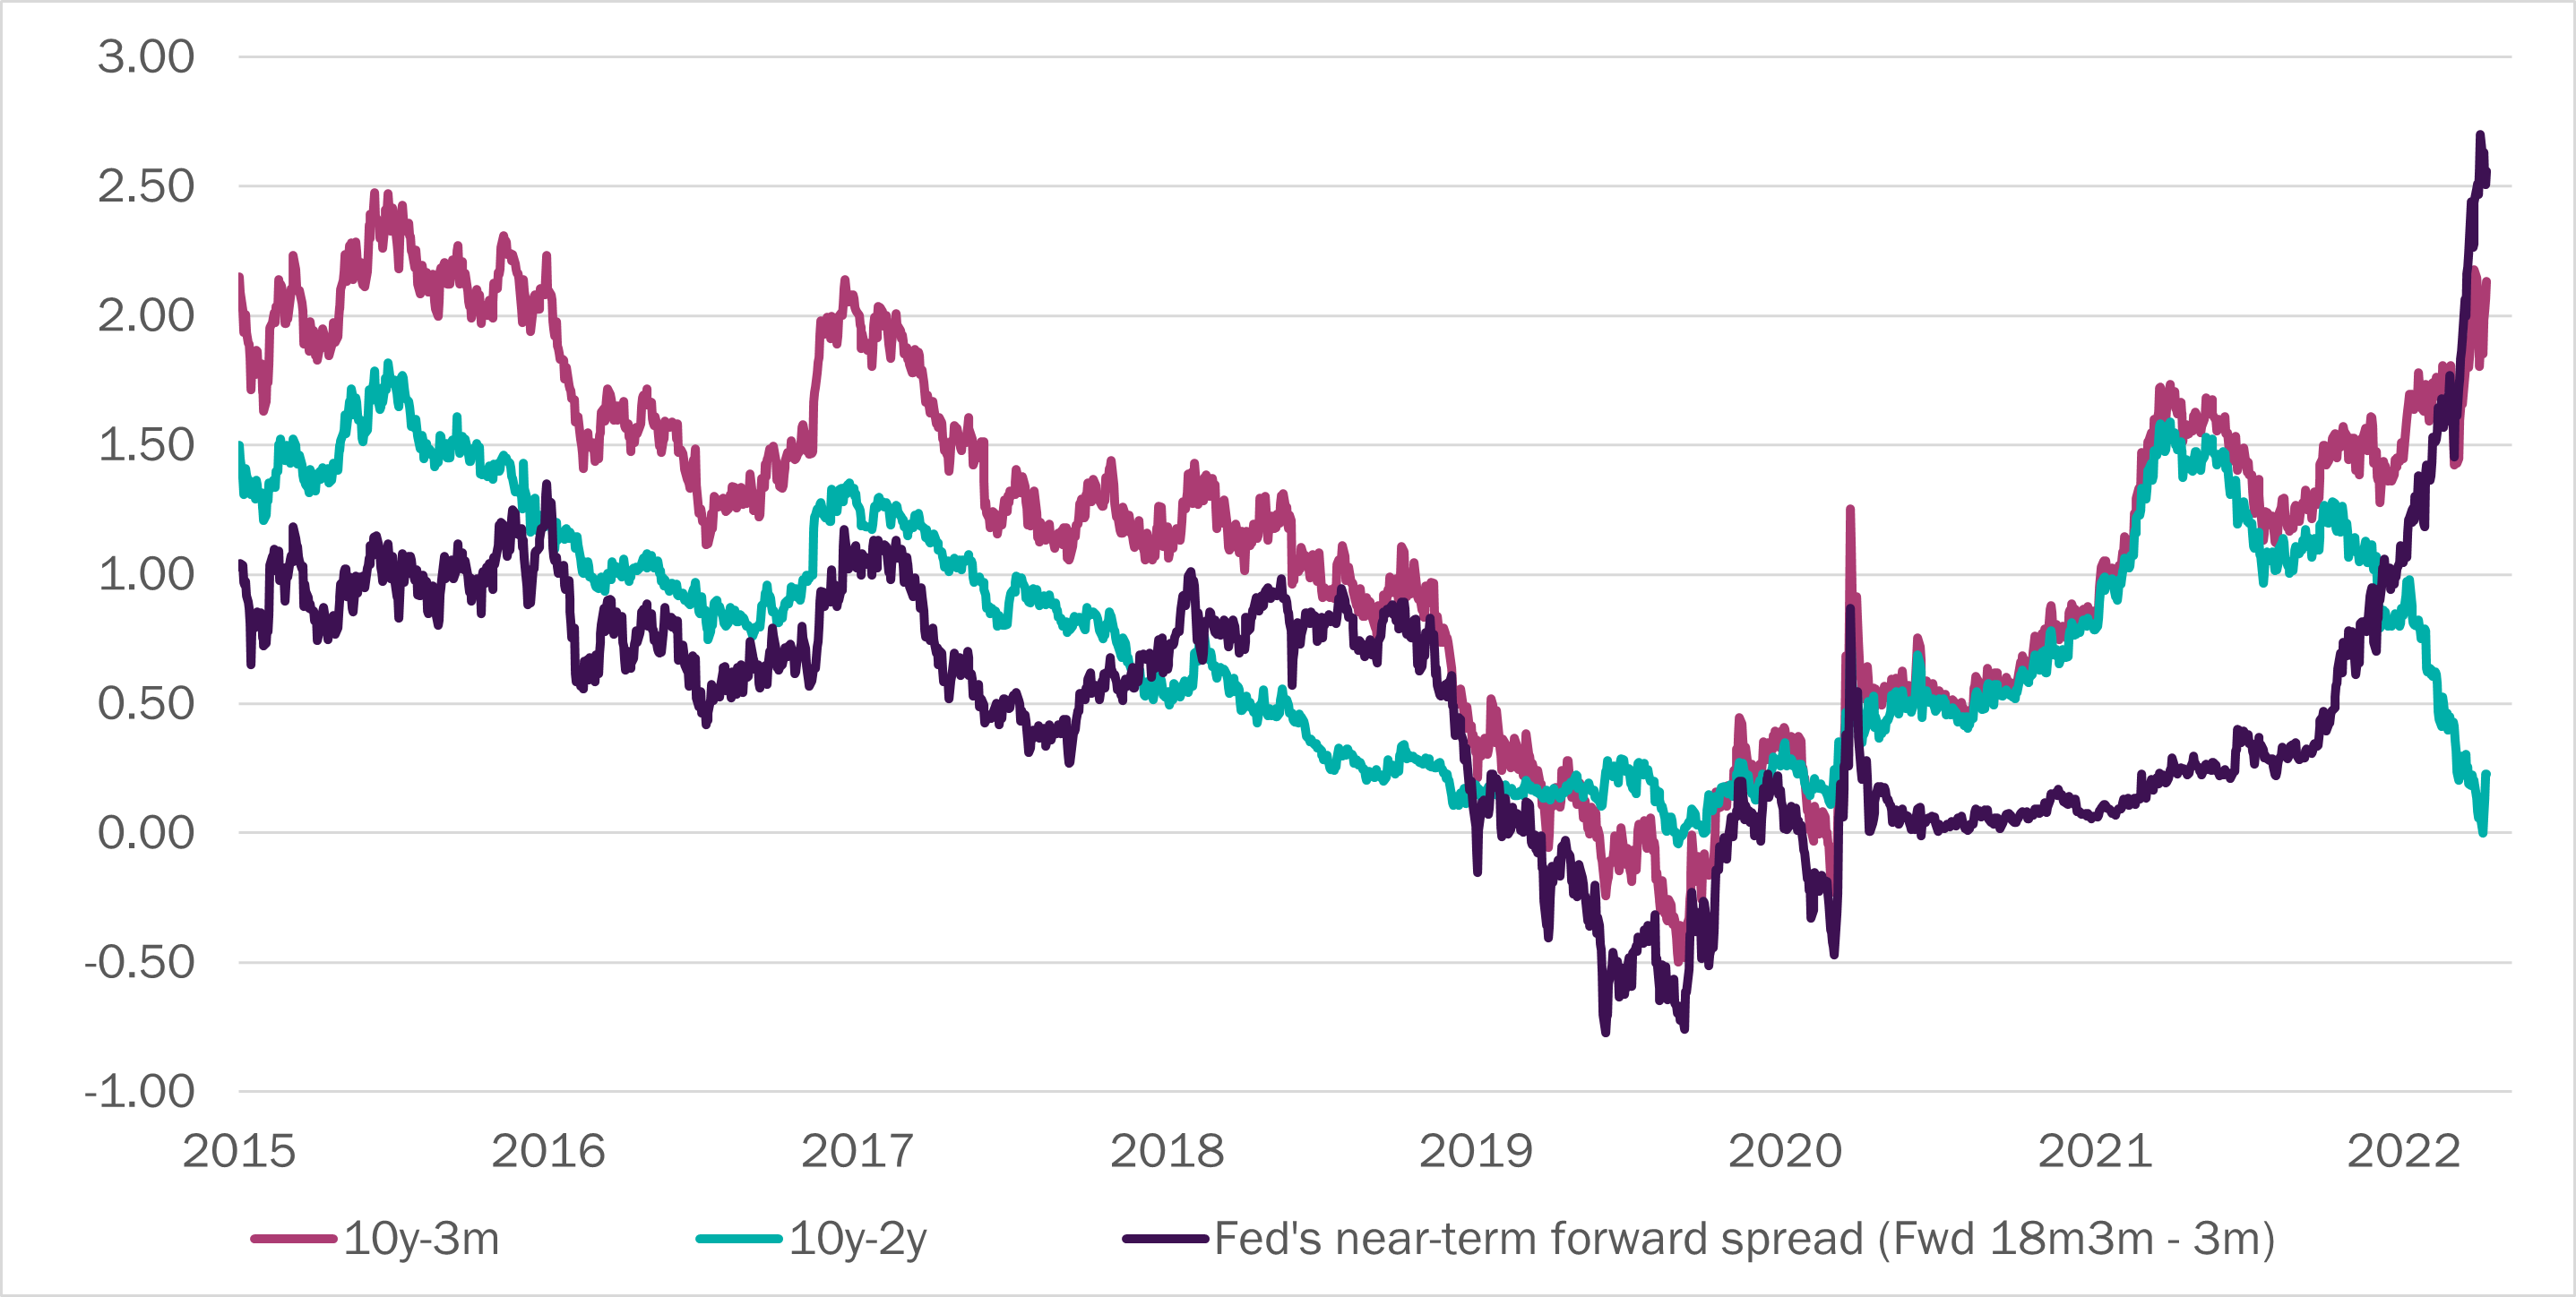
Source: Refinitiv Datastream/Bloomberg/Tilney Investment Management Services Limited, data as at 11 April 2022. Past performance is not a guide to future performance.
When compared to the 10-year yield, which of the short-term instruments (3m or 2yr) is a better guide? We constructed regression models to assess the chance of recession according to three different spread measures – 10yr-2yr, 10yr-3m, and the near-term forward spread – and found that all of them do a good job. However, we note the 10yr-2yr is inferior, producing less timely and decisive estimates of subsequent recession compared to the models which used shorter term spread measures.
Why might shorter-term measures be more useful?
They reflect expectations of Fed policy over the shorter-term more accurately. Longer-term yields have more influences: 10-year yields, for example, do not just reflect monetary policy expectations, but also issuance, inflation and long-term risk premia. The 2-year yield will also have similar influences other than pure policy expectations. Indeed, Federal Reserve policymakers believe that measures that focus on policy expectations provide a better signal.
The term premium also influences longer term yields and it has fallen significantly, turning negative over the last market cycle. Term premium is influenced by the changing inflationary outlook or changing supply and demand dynamics, which have driven it lower in recent years. This suggests that were it not for these technical factors, the 10-year yield would be higher. The term premium may move higher from here as the Federal Reserve reduces the size of its balance sheet (quantitative tightening), which all things equal, should pull the 10-year yield up in turn.
What does this mean for asset price performance?
Looking at previous occasions we saw an inversion in 10yr-3m yield curve (for which we have the longest history), we find more defensive and value-orientated areas tend to lead equity markets, including financials and manufacturing companies. Some sectors continue to do well post-inversion, notably financials, consumer staples and utilities. The information technology and telecoms sectors tend not to perform well in the run-up to yield curve inversion, and also perform poorly afterwards (See Table 1).
Table 1: Average performance of global equity sectors around the time of initial yield curve inversion
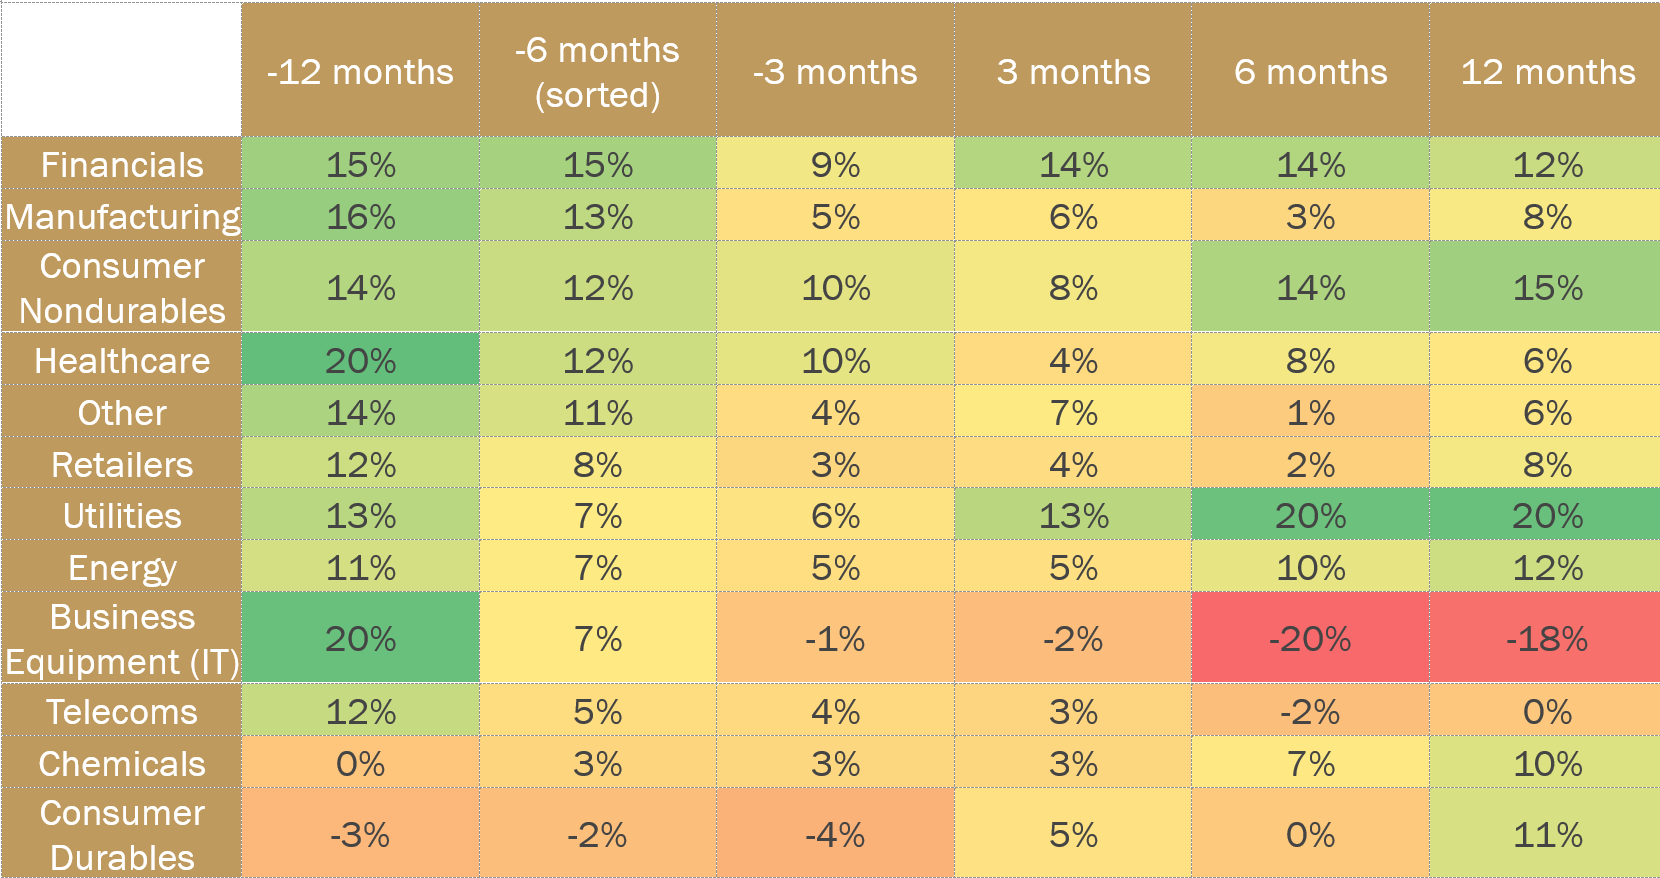
Source: Global Financial Data/Ken French/Tilney Investment Management Services Limited. Based on average performance of the last three recessions (i.e. 1990, TMT, GFC, excluding pandemic) in USD.
In terms of countries, emerging markets are the standout performer in the run up to curve inversion. However, they perform poorly afterwards, perhaps reflecting their historical position as being a geared play on the fortunes of more developed economies. Europe and the UK deserve a special mention for good performance going in and resilience coming out. This is largely because of their higher weightings in value-oriented and defensive sectors like energy and healthcare.
For other assets, it is more difficult to draw firm conclusions. The different segments in fixed income, for example, have performed very differently at each curve inversion. It is a similar picture for gold. It would appear the performance of these assets is more linked to the economic idiosyncrasies of each of those particular times, rather there being broad conclusions that can be drawn as we can with some areas of the equity market.
In conclusion
We believe it is important to focus on shorter-term yield curve measures and worry less about the 10yr-2yr, where so much press attention is focused. Today, we expect the 3-month yield to move higher, as the Fed tightens monetary policy over the coming year. This means the treasury yield curve is likely to flatten, but not quickly, so we don’t think the bond market is flashing a recessionary warning signal… yet.
Important information
By necessity, this briefing can only provide a short overview and it is essential to seek professional advice before applying the contents of this article. This briefing does not constitute advice nor a recommendation relating to the acquisition or disposal of investments. No responsibility can be taken for any loss arising from action taken or refrained from on the basis of this publication. Details correct at time of writing.
The value of an investment, and the income from it, may go down as well as up and you may get back less than you originally invested. Past performance is not a guide to future performance.
Sources
1 Refinitiv